在 Hermes 中进行性能分析
你可以使用Hermes在 React Native 应用中可视化 JavaScript 的性能。Hermes 是一个小型且轻量的 JavaScript 引擎(你可以在这里阅读更多有关在 React Native 中使用它的信息)。Hermes 有助于提高应用性能,并且还提供了分析其运行的 JavaScript 性能的方式。
在本节中,您将学习如何对在 Hermes 上运行的 React Native 应用进行分析,并如何使用Chrome DevTools 上的性能选项卡可视化配置文件。
请确保您已在应用中启用 Hermes
按照以下步骤开始分析:
记录 Hermes 采样分析
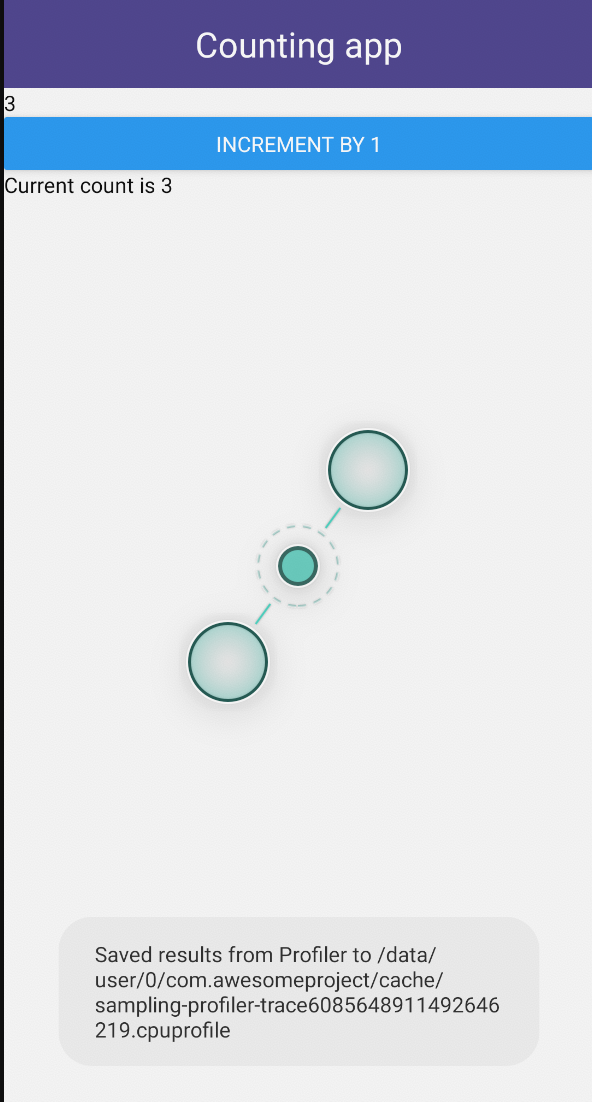
从开发菜单记录采样分析器:
- 导航到正在运行的 Metro 服务器终端。
- 按"d"键打开开发菜单。
- 选择启用采样分析器。
- 在应用中执行 JavaScript(按按钮等)。
- 再次按"d"键打开开发菜单。
- 选择禁用采样分析器以停止记录并保存采样分析器。
会显示一个提示,指示采样分析器保存的位置,通常在/data/user/0/com.appName/cache/*.cpuprofile
Execute command from CLI
You can use the React Native CLI to convert the Hermes tracing profile to Chrome tracing profile, and then pull it to your local machine using:
npx react-native profile-hermes [destinationDir]
Enabling source map
You may read about source maps on the Debugging Release Builds page.
Common errors
adb: no devices/emulators found or adb: device offline
- Why this happens The CLI cannot access the device or emulator (through adb) you are using to run the app.
- How to fix Make sure your Android device/emulator is connected and running. The command only works when it can access adb.
There is no file in the cache/ directory
- Why this happens The CLI cannot find any .cpuprofile file in your app's cache/ directory. You might have forgotten to record a profile from the device.
- How to fix Follow the instructions to enable/disable profiler from device.
Error: your_profile_name.cpuprofile is an empty file
- Why this happens The profile is empty, it might be because Hermes is not running correctly.
- How to fix Make sure your app is running on the latest version of Hermes.
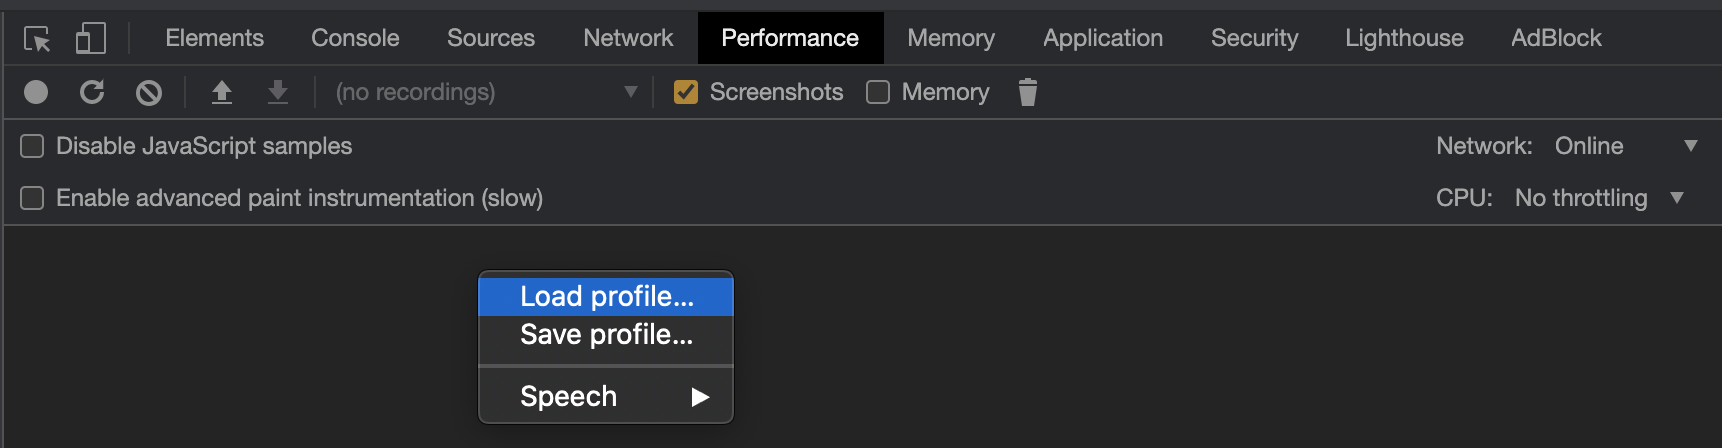
Open the downloaded profile in Chrome DevTools
To open the profile in Chrome DevTools:
- Open Chrome DevTools.
- Select the Performance tab.
- Right click and choose Load profile...
How does the Hermes Profile Transformer work?
The Hermes Sample Profile is of the JSON object format, while the format that Google's DevTools supports is JSON Array Format. (More information about the formats can be found on the Trace Event Format Document)
export interface HermesCPUProfile {
  traceEvents: SharedEventProperties[];
  samples: HermesSample[];
  stackFrames: {[key in string]: HermesStackFrame};
}
The Hermes profile has most of its information encoded into the samples and stackFrames properties. Each sample is a snapshot of the function call stack at that particular timestamp as each sample has a sf property which corresponds to a function call.
export interface HermesSample {
  cpu: string;
  name: string;
  ts: string;
  pid: number;
  tid: string;
  weight: string;
  /**
   * Will refer to an element in the stackFrames object of the Hermes Profile
   */
  sf: number;
  stackFrameData?: HermesStackFrame;
}
The information about a function call can be found in stackFrames which contains key-object pairs, where the key is the sf number and the corresponding object gives us all the relevant information about the function including the sf number of its parent function. This parent-child relationship can be traced upwards to find the information of all the functions running at a particular timestamp.
export interface HermesStackFrame {
  line: string;
  column: string;
  funcLine: string;
  funcColumn: string;
  name: string;
  category: string;
  /**
   * A parent function may or may not exist
   */
  parent?: number;
}
At this point, you should define a few more terms, namely:
- Nodes: The objects corresponding to
sfnumbers instackFrames - Active Nodes: The nodes which are currently running at a particular timestamp. A node is classified as running if its
sfnumber is in the function call stack. This call stack can be obtained from thesfnumber of the sample and tracing upwards till parentsfs are available
The samples and the stackFrames in tandem can then be used to generate all the start and end events at the corresponding timestamps, wherein:
- Start Nodes/Events: Nodes absent in the previous sample's function call stack but present in the current sample's.
- End Nodes/Events: Nodes present in the previous sample's function call stack but absent in the current sample's.
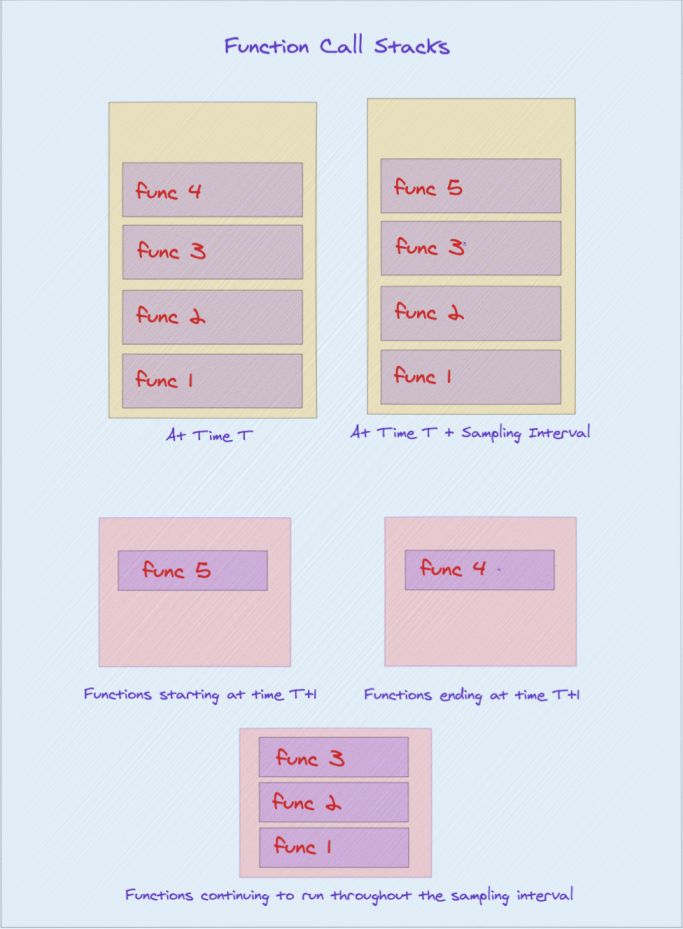
You can now construct a flamechart of function calls as you have all the function information including its start and end timestamps.
The hermes-profile-transformer can convert any profile generated using Hermes into a format that can be directly displayed in Chrome DevTools. More information about this can be found on @react-native-community/hermes-profile-transformer